NEW YORK – Nielsen has released its last weekly installment of Nielsen Total US dollar sales data, closing a 16-week period ending on June 20, in which elevated sales have held strong. Over the last several weeks sales have remained elevated just over the double-digit threshold.
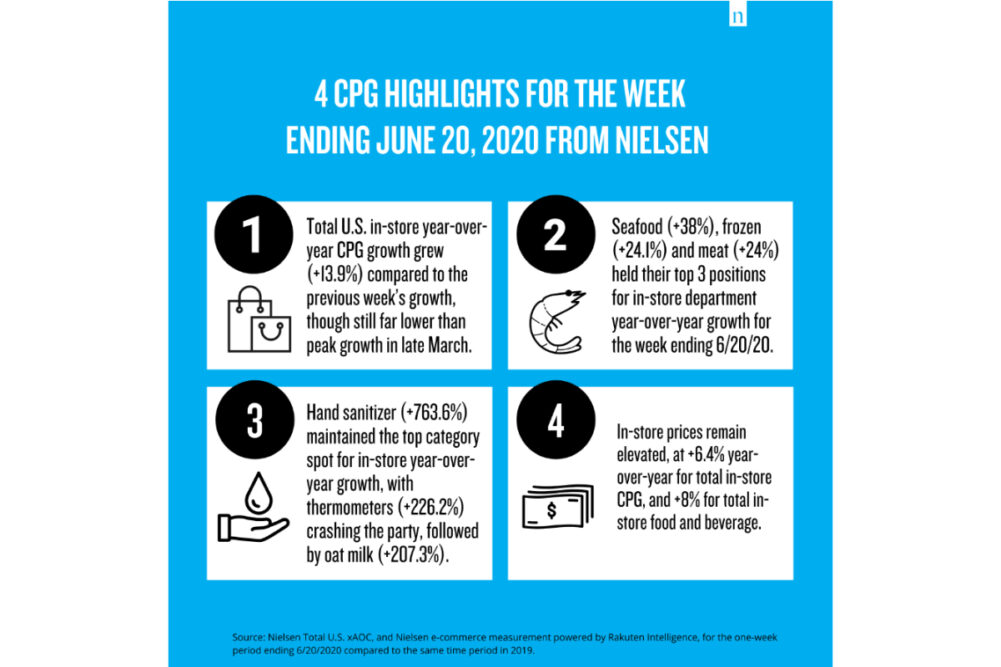
The latest data shows that grocery sales for instore consumer packaged goods sales (CPG) for food and beverage in the United States were up 13.9% the week ending on June 20 and online food sales were up 64.3%.
Within departments, the seafood category held onto its lead with the largest year-over-year growth compared to any other category, followed by frozen and then meat. Average unit prices are still up compared to 2019 across the board.
Nielsen is closing the book on its weekly reports as the US gradually makes the shift from restricted living to reopening and living a new normal in which sales patterns are continuously elevated. The data firm is continuing to monitor sales trends and will share new insights when they are relevant.
The charts below break down Nielsen’s sales data by department and meat, seafood, dairy and alternatives for the week ending on June 20 and the 16 weeks leading up to it and show differences in sales prices compared to 2019. Within department data the highest and lowest sales weeks of the 16-week period are also noted: